Logging AWS ConsoleLogin events
by Sebastien Mirolo on Mon, 6 Jan 2025
 As part of continuous Cybersecurity updates, we decided to alert
the Ops team on any successful or unsuccessful attempts to login into
the AWS Console.
Understanding AWS signin API
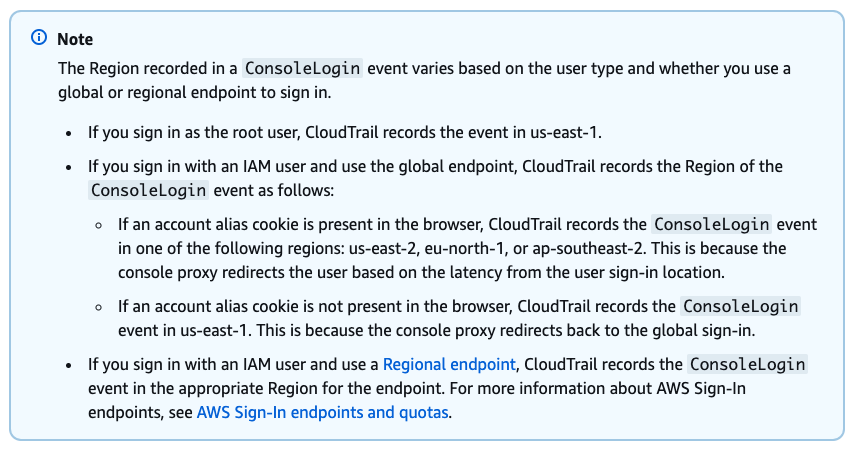
AWS IAM are global. The Sign In API (signin.aws.amazon.com) was also global,
but it is not longer the case. As a result, the ConsoleLogin
event will be recorded in CloudTrail in the region of the endpoint used
to signin (AWS Management Console sign-in events).

We tested AWS documentation by running a few experiments:
| Signin URL | User | Region where ConsoleLogin is recorded |
|---|---|---|
| https://signin.aws.amazon.com/console | IAM user | us-east-2 |
| https://us-west-1.signin.aws.amazon.com/console | IAM user | us-east-2 |
| https://signin.aws.amazon.com/console?region=us-west-1 | IAM user | us-west-1 |
Since we are only using a handful of regions, the first idea was to disable all but the regions we care about. Unfortunately, you cannot enable or disable a Region that is enabled by default. (i.e. Regions introduced before March 20, 2019). It is also possible to restrict execution of AWS actions in all but the regions we care about through aws:RequestedRegion, but that does not include login to the console. It is still possible to login to the console through a restricted region endpoint.
So the only thing left to aggregate ConsoleLogin events in a single region is to create an EventBridge rule in all the default regions.
"To centralize the processing of ConsoleLogin events in a specific region, create a multi-region CloudTrail trail to capture events from all regions. Then, set up EventBridge rules in each region to forward ConsoleLogin events to a central event bus in your preferred region. Finally, configure a central EventBridge rule in that region to trigger notifications or processing actions based on the forwarded events." - SNS ConsoleLogin for every region
Alerting on ConsoleLogin events through CloudWatch
Once we have added an EventBridge rule in all default regions to forward
ConsoleLogin events to the aggregator region, we can add
a special EventBridge rule in that region to send alerts.
EventBridge supports a wide range of targets from a straightforward API endpoint to various AWS services.
It might be overkill to use CloudWatch here, but why not. We are going to forward the CloudTrail events to a CloudWatch log group in our preferred aggregator region, and create a CloudWatch metric to alert on ConsoleLogin successes and failures.
We browse to CloudWatch > Log groups, and click on Create log group
ATTENTION It is important here to
name the log group /aws/events/some-name. Without
the /aws/events prefix, that log group cannot be found
properly as an EventBridge target.
We browse to CloudTrail > Dashboard, and click on Create trail. In the section CloudWatch Logs - optional, we click Enabled, then specify Existing and type the name of the log group we previously created. Remember that the suggested default name for creating a new log group will not behave well when forwarding events through EventBridge.
ATTENTION Make sure you create a Multi-region trail. I couldn't figure out exactly why this is still necessary since events are logged in their respective regions, but it seems important.
We then go back to the log group, i.e. CloudWatch > Log groups > /aws/events/*some-name*, and go to the Metric filters tab. Click Create metric filter. We set the Filter pattern to:
{ (($.eventName = ConsoleLogin) && ($.responseElements.ConsoleLogin = "Success")) || (($.detail.eventName = ConsoleLogin) && ($.detail.responseElements.ConsoleLogin = "Success")) }We note here that the event generated in the aggregator region, and forwarded from other regions don't have the same schema. So we need to filter for both.
We set Metric value to 1, and Unit to Count.
We create another metric filter for console sign-in failures with the following Filter pattern to:
{ ($.eventName = ConsoleLogin) && ($.errorMessage = "Failed authentication") || ($.detail.eventName = ConsoleLogin) && ($.detail.errorMessage = "Failed authentication") }Note that when you are creating alarms, sometimes CloudWatch cannot find your metrics. It's likely because either the metrics haven't been recently published (within the last two weeks)
Et voila! It only remains to use a different browser and login under different region endpoints to check alerts are triggered properly.
More to read
If you are looking for related posts, [Datadog] Non-Production Endpoints as an Attack Surface in AWS, Auto-update of Letsencrypt Wildcard TLS Certificates and PostgreSQL, encryption and AWS RDS instance are good reads.
More technical posts are also available on the DjaoDjin blog. For fellow entrepreneurs, business lessons learned running a subscription hosting platform are also available.
